
Mean Absolute Deviation (MAD) is an important statistical indicator that displays the average of the deviation of each of the data points with the mean of a set of data. Understanding how to find MAD helps analyze the spread of data more accurately and provides a clear picture of variability, often with less sensitivity to extreme values than standard deviation.
This is commonly applied in education to measure consistency of student performance, in finance to measure the fluctuation of stock market, and in quality control to measure the reliability of products. Learning how to find MAD empowers anyone to make informed decisions based on data patterns and trends.
The Formula for MAD
The Mean Absolute Deviation (MAD) is calculated using the formula:
MAD=n1i=1∑n∣xi−μ∣
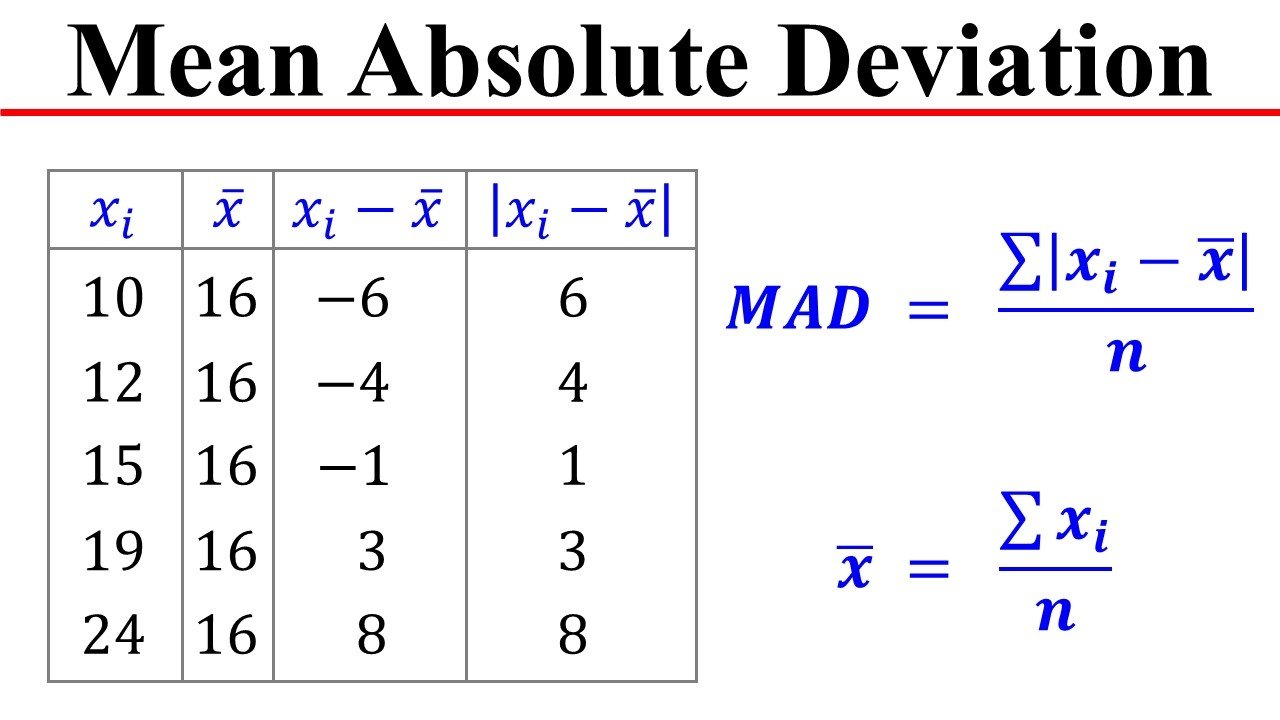
Where:
- xi represents each data point
- μ\muμ is the mean of the dataset
- nnn is the total number of data points
To calculate MAD, the mean of your data must be calculated. Compute the absolute deviation of each data value and the mean. Lastly, take the average of these absolute differences. This procedure gives an indication of the mean distance of each data point and the mean, which give some indication of the variability of the data set.
Step-by-Step Guide to Calculating MAD
Here is a step-by-step guide to calculating the mean absolute deviation (MAD):
Step 1: Calculate the Mean (μ)
Add up all the data points and divide by the number of points. Take the case of the dataset [2, 4, 6, 8]:
μ=42+4+6+8=5
Step 2: Find the Absolute Deviations
Subtract the mean from each data point and take the absolute value:
|2 − 5| = 3
|4 − 5| = 1
|6 − 5| = 1
|8 − 5| = 3
Step 3: Sum the Absolute Deviations
3 + 1 + 1 + 3 = 8
Step 4: Divide by the Number of Data Points
MAD=48=2
Therefore, the MAD of this data is 2, which means how far, on average, each data point is of the mean.
Practical Example
Dataset: Temperature (°C) daily over 5 consecutive days: 25, 24, 26, 23, 22 .
Step 1: Calculate the Mean (μ)
μ=525+24+26+23+22=24
Step 2: Determine Absolute Deviations from the Mean
|25 − 24| = 1
|24 − 24| = 0
|26 − 24| = 2
|23 − 24| = 1
|22 − 24| = 2
Step 3: Calculate the Mean of Absolute Deviations (MAD)

MAD=51+0+2+1+2=1.2
The MAD of 1.2°C is an indication that the daily temperatures are on average 1.2°C off the mean. This metric gives information on the variability of temperatures during the studied time.
MAD vs. Standard Deviation
Here is a short and simple comparison of mean absolute deviation (MAD) and standard deviation:
| Feature | Mean Absolute Deviation (MAD) | Standard Deviation (SD) |
| Calculation | Average of absolute deviations from the mean | Square root of the average of squared deviations |
| Sensitivity to Outliers | Less sensitive; outliers have minimal impact | More sensitive; outliers significantly affect value |
| Interpretability | Easier to understand and compute | More complex; involves squaring and square roots |
| Use Cases | Preferred when data contains outliers or is skewed | Suitable for normally distributed data |
MAD is an easy measure of variability, and this makes it applicable in datasets with outliers. SD on the other hand is more widely applied in statistical analysis because of its mathematical characteristics, particularly when the data are normally distributed.
Applications of MAD
Mean Absolute Deviation (MAD) is a general purpose measuring tool that can be applied in any industry to determine the measure of variability and consistency. Its resistance to outliers is what makes it especially useful in practice.
- Education: MAD assists educators in determining how consistent student performance is over a period of time and what patterns and areas of concern are involved.
- Finance: In financial markets, MAD is used to gauge the volatility of stock prices to help in risk assessment and portfolio management.
- Manufacturing: MAD is used by quality control teams to ensure the consistency of product dimensions, and maintain product specifications and reduce defects.
- Healthcare: MAD can be used to monitor changes in the recovery time of patients to help in the optimization of treatment schedules and enhance patient outcomes.
MAD helps make better decisions and increases operational effectiveness in these areas by offering a clear indicator of variability.
Common Misconceptions
1. MAD ≠ Median Absolute Deviation
Both are abbreviated as MAD, but they are different in calculation. MAD (Mean Absolute Deviation) is the average of the absolute deviations around the mean, whilst Median Absolute Deviation is the median of the absolute deviations around the median. The latter is more resistant to outliers and is commonly applied to outlier detection.
2. MAD is Not Completely Resistant to Outliers

MAD is stronger than standard deviation but not totally resistant to outliers. Extreme values may also affect MAD in small samples.
Read Also: Enhance Your Gameplay: Top Gaming Mods on LCFGameNews
3. MAD ≠ Standard Deviation
Standard deviation and MAD are different indicators. MAD is based on absolute deviations whereas standard deviation is based on squared deviations. This variance renders standard deviation to be more susceptible to outliers.
Final Word
Learning how to find MAD is critical to the analysis of data variability and the decision making process. Learning how to compute MAD enables you to evaluate the consistency and identify trends in a wide range of data, whether test results or financial trends. When implementing this measure in real-life situations, you will be able to achieve greater precision and insight in your analyses. Learn more about the topic and statistical tools to be able to apply MAD in your own data-driven tasks confidently.
Read More: T20 Tri-Series Zimbabwe – Group Stage Recap and Betting Guide with Linebet